AI Tools
ChatGPT Now Builds Interactive Charts — How to Use Them for SaaS Reports

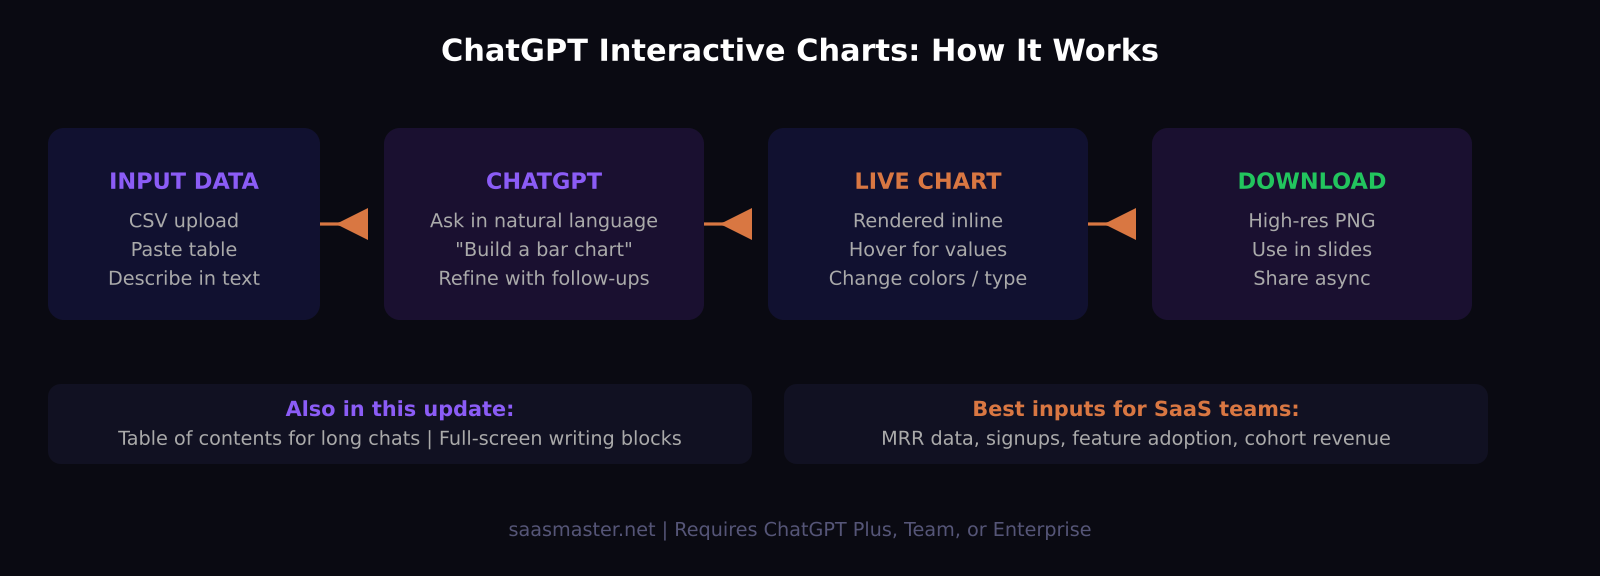
ChatGPT can now build interactive charts directly inside a conversation. You describe your data, ask for a bar, line, pie, or scatter chart, and ChatGPT renders it inline — no Python, no export, no pivot to a separate tool. For SaaS teams, this is a meaningful workflow shortcut: investor updates, feature adoption summaries, cohort comparisons, and sales metrics can go from raw numbers to a shareable visual in minutes, entirely within a ChatGPT session.
Key takeaways
- ChatGPT's interactive charts feature lets you build bar, line, pie, and scatter charts through natural language, then hover, customize, and download them without leaving the chat
- The feature is available on ChatGPT Plus, Team, and Enterprise plans — not on the free tier
- Conversations longer than five responses now include a table of contents for faster navigation within long sessions
- Full-screen writing blocks make long-form drafting inside ChatGPT feel more like a document editor
- You can upload CSV or Excel files, paste raw data, or describe hypothetical data — all three work as inputs for chart generation
What the interactive charts feature does
Before this update, getting a chart from ChatGPT meant asking it to write Python code, interpreting a static screenshot, or copying data into a separate spreadsheet. The new interactive charts feature renders live charts directly in the response pane using browser-native visualization. The charts are dynamic: you can hover over data points to see exact values, click to filter categories, change the chart type or colors by asking in follow-up messages, and download the result as an image when you are done.
The supported types are bar, line, pie, and scatter. That covers the majority of what SaaS teams need for internal reporting, stakeholder updates, and product dashboards at the draft stage. The charts are rendered at a resolution suitable for presentation slides, which means you can take them from ChatGPT into a deck without the grainy screenshot problem that plagued earlier workflow attempts.
How to use ChatGPT interactive charts: step by step
Start by opening ChatGPT with GPT-5.5 or GPT-5.3 selected. Then input your data using one of three methods: upload a CSV or Excel file using the attachment icon, paste a table or structured list of numbers directly into the chat, or simply describe the data in natural language if you are working with hypothetical or mockup numbers.
Ask for a chart explicitly. A prompt like "Build a bar chart showing monthly new signups from January through June 2026" works well. ChatGPT renders the chart inline in the response. From there you can refine it conversationally:
- "Switch this to a line chart with a trend line"
- "Change the color scheme to dark background with orange bars"
- "Add percentage labels above each bar"
- "Which three months had the highest month-over-month growth?"
- "Remove the outlier in March and regenerate"
Each refinement updates the chart in the same session. When the chart looks right, use the download button below it to save as a PNG. The image exports at high resolution, typically suited for a 16:9 slide at full size.
Where this helps SaaS teams most
The highest-value use cases cluster around two areas: internal reporting and external communication.
For internal reporting, the bottleneck is usually not analysis — it is visualization. Most SaaS operators already know their numbers; getting those numbers into a chart format that can be dropped into a Notion page, Slack message, or internal deck has historically required switching tools. With interactive charts, the workflow stays inside ChatGPT: pull your metrics, paste them in, generate the chart, refine it, download it. A weekly metrics summary that used to require a spreadsheet round-trip now happens in the same session as the analysis.
For external communication — investor updates, partnership decks, customer success quarterly business reviews — the need is for clean, clear visuals that communicate a trend quickly. Interactive charts produce outputs that are good enough for these contexts without the full overhead of a design tool. For a first draft or an async Notion-based investor update, the quality is sufficient. For a formal pitch deck where brand consistency matters, you will still want to finalize in Slides or Figma.
Using this for mockups and demos
One use case that is easy to overlook: describing hypothetical data. If you are building a SaaS product demo, a sales pitch, or a concept slide, you can say "Show a chart of a SaaS product with ARR growing from $50K in January 2026 to $420K in June 2026" and ChatGPT generates a plausible, visually clean chart with no real data required. This is faster than building a placeholder chart in Google Sheets for a wireframe or mockup context.
The other features in the same update
The table of contents feature is worth calling out separately because it addresses a real pain point in longer ChatGPT sessions. Conversations that exceed five responses now display a navigable sidebar with section headings. For anyone who has conducted a long research session — evaluating a vendor, working through a product strategy, reviewing a document with iterative prompts — and then needed to find a specific answer buried forty messages deep, this is a genuine quality-of-life improvement. The table of contents is auto-generated based on the structure of the conversation.
Full-screen writing blocks expand long-form responses — blog drafts, reports, release notes, strategy documents — into a distraction-free editor pane inside ChatGPT. You can continue editing within that pane with follow-up prompts. The experience is closer to writing in a document than reading a chat bubble, which makes iterative long-form drafting noticeably more comfortable. For SaaS teams that use ChatGPT for release notes, product announcements, or documentation drafts, it is a small but real improvement.
My honest take
Interactive charts will not replace Tableau, Looker, or even Google Sheets for production analytics. What they do is collapse the distance between having numbers and having a visual that communicates those numbers clearly. The natural-language refinement loop — "add a trend line," "change the color," "highlight the highest month" — is what makes this different from simply pasting data into a charting library. For the everyday SaaS reporting and communication use cases that do not justify a full BI tool, this is a meaningful upgrade.
Frequently asked questions
What ChatGPT plan do you need for interactive charts?
Interactive charts are available on ChatGPT Plus at $20 per month, and on Team and Enterprise plans. They are not available on the free tier.
Can you upload a spreadsheet to make charts in ChatGPT?
Yes. You can attach a CSV or Excel file and ask ChatGPT to build a chart from the data. You can also paste data as plain text or describe hypothetical data if you are building a mockup or placeholder visual.
Are ChatGPT interactive charts good enough for real presentations?
For internal presentations, async updates, and investor briefs, yes — the download quality is sufficient. For polished, brand-consistent pitch decks where typography and color system consistency matter, you will want to bring the chart into Slides, Figma, or your design tool of choice to finalize it.
Was this article helpful?
SaaS Master
Creator behind SaaS Master — tutorials, walkthroughs, reviews, and explainers that help SaaS, AI, and WordPress products get understood and chosen. Writing here about the tools, trends, and tactics that actually move the needle. Work with me →
Want your product explained this clearly — in video?
Tutorials, walkthroughs, reviews, and shorts for SaaS, AI, and WordPress products.
Work With SaaS Master
